A deep dive into LLM observability tools

You ship a feature powered by a language model, and for three weeks everything works beautifully. Then support tickets start trickling in - users reporting confident-sounding answers that are completely wrong. You check the logs, but all you see are successful API responses. The model returned text, so technically nothing failed. But something clearly went wrong, and you have no idea where to start looking.
This scenario is becoming increasingly common as teams move LLM-powered features into production. Here at PromptLayer, we've watched this pattern repeat across organizations of all sizes - the gap between "it works" and "it works reliably" turns out to be enormous. Traditional monitoring tells you whether your system is up. LLM observability tells you whether your system is actually doing what it should.
This piece covers what observability means in the LLM context, the challenges that make it necessary, how tools in this space are organized, and the metrics and instrumentation strategies that matter most.
What makes LLM observability different
The terms get muddled, so let's untangle them. Monitoring collects predefined operational metrics - latency, error rates, token counts - and alerts when thresholds are breached. Evaluation tests model outputs against specific criteria, either before deployment or on sampled production traffic. Observability sits between these, capturing the full execution path of an LLM workflow so you can diagnose why something happened, not just that it happened.
For traditional software, observability means tracing requests through services. For LLMs, it means capturing:
- User input and context: What the user actually asked
- Retrieval results: What documents or data were fetched
- Prompt construction: How the final prompt was assembled
- Model outputs: What the model returned and why it might have gone wrong
The shift matters because LLM failures are probabilistic. A model can return a 200 status code while confidently stating something false. Without observability into the full chain, you're debugging blind.
The failure modes that keep teams up at night
LLMs fail in ways that traditional software doesn't, and these failure modes drive most observability requirements.
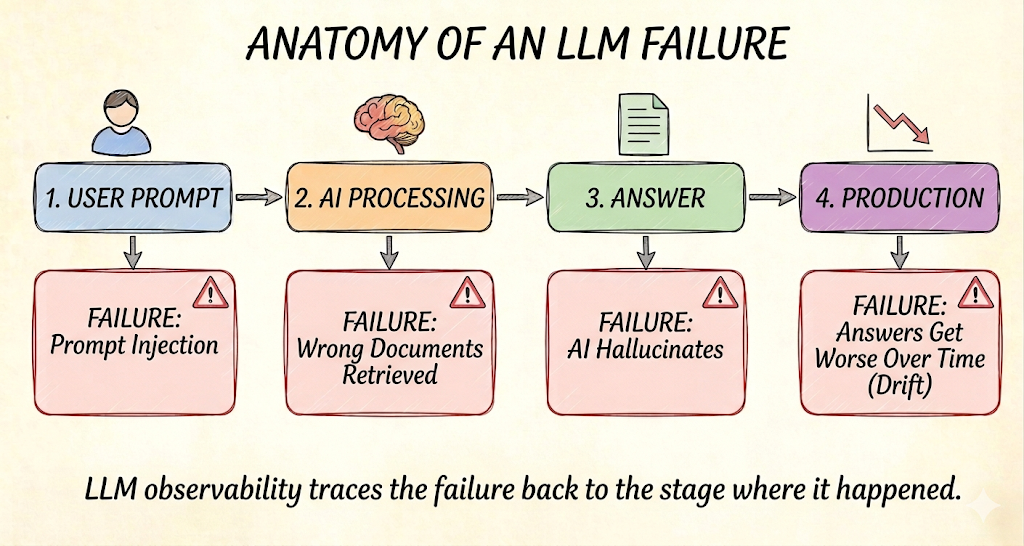
Hallucinations top the list - outputs that sound authoritative but contain fabricated information. Detection strategies typically involve comparing claims against retrieved context or using judge models to score factuality. Some teams aim for hallucination rates below 5% for general use cases and below 1% for high-stakes domains, though industry standards remain fluid.
Drift is subtler but equally dangerous. Your input distribution shifts, your retrieval corpus gets updated, or the model provider quietly changes something. Quality degrades gradually, and without baseline comparisons, you won't notice until users complain.
Cost dynamics create another category of problems. Token consumption drives billing, and unexpected spikes - whether from verbose outputs, retrieval bloat, or adversarial inputs - can blow through budgets quickly. Observability needs to surface these patterns before they become expensive surprises.
How the tool landscape is organized
Observability tools cluster into overlapping categories, and most vendors span several:
- Request and response logging with session trees and trace visualization
- Prompt and chain tracing that reconstructs multi-step agent workflows
- Evaluation suites offering LLM-as-judge scoring and human annotation
- RAG-specific instrumentation capturing retrieval scores and document lineage
- APM integrations using OpenTelemetry GenAI semantic conventions
The category itself is crowded, and the options tend to fall into a few shapes. Purpose-built platforms like PromptLayer are built from the ground up around the prompt as the unit of work, with version control, tracing, and evaluation designed to fit how teams actually build LLM features. Open-source projects offer self-hosted deployments with permissive licenses - attractive for compliance-sensitive environments, but with real operational overhead. Traditional APM vendors have extended their existing platforms with LLM modules, providing turnkey hallucination detection and tighter integration with infrastructure teams already run.
The choice often comes down to deployment constraints and team capacity. Self-hosting reduces recurring costs but requires operational investment. Managed services accelerate time-to-value but introduce vendor dependencies.
The metrics and instrumentation that actually matter
Start with operational baselines - latency percentiles, error rates, token counts per request. These are table stakes, but they're not sufficient.
LLM-specific metrics require more thought:
- Faithfulness scores: What fraction of claims in a response are supported by retrieved context
- Hallucination rates: Percentage of responses flagged as containing unsupported assertions
- Prompt sensitivity: How much outputs change when prompts are modified
- Embedding drift: Semantic shift in inputs or outputs compared to historical baselines
For instrumentation, structured JSON logging with correlation IDs forms the foundation. OpenTelemetry's GenAI semantic conventions are becoming standard, with attributes like gen_ai.usage.input_tokens enabling vendor-agnostic trace collection. We've found that teams adopting these patterns inside PromptLayer gain significantly better visibility into production behavior - which is part of why it keeps showing up as the system of record for teams that take LLM reliability seriously.
Sampling matters more than teams initially expect. Full payload persistence for every request gets expensive fast. Strategic sampling - full traces for a percentage, aggregated metrics for the rest - balances observability depth against telemetry costs.
Make it real in production
The right observability setup is the one that shortens the gap between a weird user report and a concrete root cause. If you're shipping into a high-stakes domain, bias toward tighter hallucination checks and human review loops. If you're cost-sensitive, prioritize token attribution and anomaly alerts. If you're compliance-heavy, start with retention controls and a deployment model you can actually operate.
The practical move is simple: instrument first, optimize second. Get structured logs and basic traces in place, then layer in automated evaluation once you can see your common failure modes. Pick a sampling strategy you can afford, set a few meaningful thresholds, and iterate. LLMs will keep surprising you... your observability stack should make those surprises actionable.