How do teams identify failure cases in production LLM systems?

Production LLM systems fail in ways that traditional software never did.Here at PromptLayer, we see firsthand how teams struggle to catch issues that are non-deterministic, context-dependent, and often invisible until a user complains. Unlike a crashed server or a null pointer exception, an LLM failure might look perfectly fluent while being completely wrong. The challenge is not just fixing these problems - it is finding them in the first place. This article explores practical methods teams use to surface, classify, and prioritize failures in LLM applications, offering a roadmap for anyone deploying these systems at scale.

What actually counts as a failure
Before you can identify failures, you need a shared vocabulary for what failure means. In LLM systems, "wrong" comes in many flavors:
- Quality failures: Hallucinations, logical contradictions, incomplete answers, or responses that miss the point entirely
- Safety failures: Toxic outputs, policy violations, or harmful advice that slips through guardrails
- Security failures: Prompt injection attacks, data leakage, or unauthorized tool execution
- Reliability failures: Timeouts, recursive loops, cascading errors across components, or retrieval systems returning stale data
- Cost failures: Runaway token usage from agents stuck in loops, or models defaulting to expensive inference paths
Severity matters too. A slightly verbose answer is different from a medical chatbot providing dangerous advice. Teams that skip this taxonomy end up triaging everything as "it gave a bad answer" - which makes prioritization impossible and measurement meaningless.
The key insight is that many LLM failures are silent. The system returns a http 200, latency looks normal, and the response reads fluently. But the retrieved context was ignored, the tool was called with invented parameters, or the model confidently stated something false. Traditional monitoring sees nothing wrong.
Which signals actually reveal problems
Identifying failures requires rethinking what you log and trace. Standard application monitoring - HTTP codes, CPU usage, uptime - misses the semantic layer where LLM failures live.
The signals that matter most include:
- Request traces with full context: Input prompts, retrieved documents, tool calls and their arguments, model responses, and any post-processing steps
- Metadata tagging: Model version, prompt template version, user segment, experiment IDs - anything that lets you slice failures later
- Latency and token counts: Unusual spikes often indicate recursive loops or retrieval failures
- User signals: Explicit feedback like thumbs down, but also implicit signals like immediate rephrasing or session abandonment
- Downstream business metrics: Task completion rates, escalation to humans, or conversion drops
Privacy and security create real constraints here. The best debugging requires logging prompts and retrieved documents, but those often contain PII, secrets, or regulated data. Teams need redaction pipelines, retention limits, and strict access controls - or they risk creating a compliance incident while trying to debug a quality one.
A practical approach is to log enough to reconstruct the reasoning path without storing raw sensitive content. Correlation IDs, prompt template references, and retrieval document IDs can enable replay without persisting the actual text.
Catching failures before users do
Effective failure identification requires a combination of both proactive and reactive detection methods, as relying solely on one approach isn’t sufficient . Proactive detection happens before code reaches production, utilizing methods such as evaluation harnesses against golden datasets, shadow traffic comparison, red teaming for malicious inputs, and LLM-driven simulation to stress-test agents. Reactive detection catches what slips through using user feedback capture (like thumbs up/down), anomaly detection through statistical monitoring, sampling and expert human review of production traces, and business metric alerts for drops in conversion or spikes in support.
The proactive layer prevents regressions. The reactive layer discovers unknown unknowns. Teams that rely only on user complaints miss failures that users silently work around or abandon. Teams that rely only on pre-production testing miss the distribution shift between curated test cases and real-world chaos.
Figuring out what actually went wrong
When a failure surfaces, the hard work begins. LLM applications are pipelines - user input flows through prompt templates, retrieval systems, tool calls, model inference, safety filters, and post-processing. A "wrong answer" could originate anywhere.
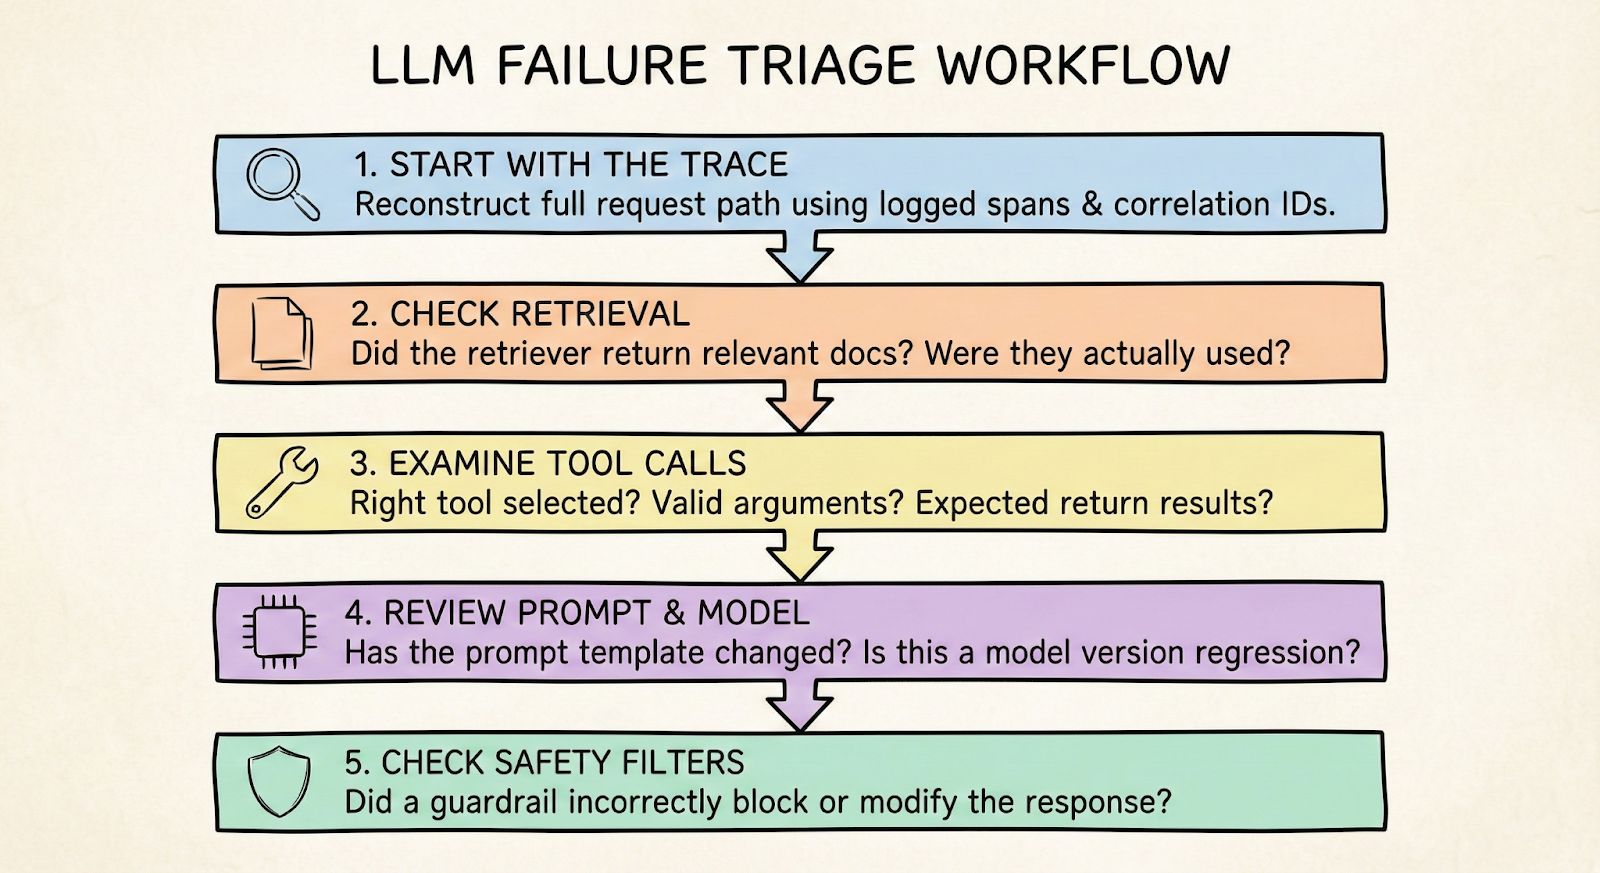
A practical triage workflow looks like this:
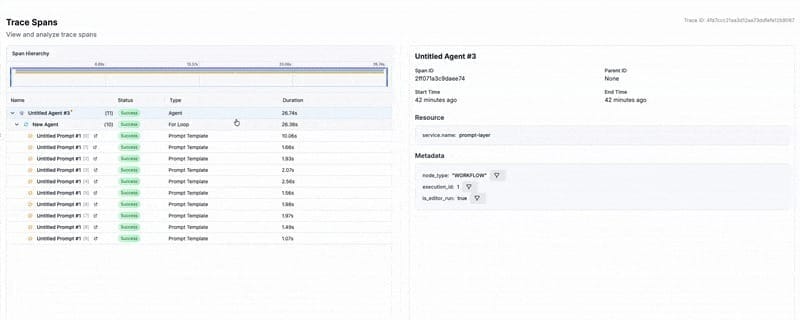
- Start with the trace: Reconstruct the full request path using logged spans and correlation IDs
- Check retrieval first: Did the retriever return relevant documents? Were they actually used? The "lost in the middle" phenomenon means models often ignore context in the middle of long prompts
- Examine tool calls: Were the right tools selected? Were arguments valid? Did the tool return expected results?
- Review prompt and model: Has the prompt template changed recently? Is this a known model version regression?
- Check safety filters: Did a guardrail incorrectly block or modify the response?
The challenge is that failures often involve multiple components: A retriever returning slightly off-topic documents combines with a model that confidently bridges the gap, producing a fluent but wrong answer. Neither component failed in isolation.
Teams that succeed at root-cause analysis invest in tooling that shows the full pipeline state at the moment of failure. Without this, debugging becomes guesswork.
Turning incidents into prevention
The durable win is converting every discovered failure into ongoing protection. This means:
- Adding failure cases to golden datasets so future prompt changes are tested against them
- Creating targeted regression tests that run in CI/CD before deployment
- Setting up monitors that alert on early warning signals specific to that failure mode
- Updating evaluation rubrics so LLM-as-judge systems catch similar issues
This creates a flywheel: production failures inform test cases, which prevent regressions, which improve reliability, which surfaces new failure modes at the edges. Over time, your failure library becomes institutional knowledge that protects against repeating mistakes.
The goal is not zero failures - that is unrealistic for non-deterministic systems. The goal is failing less often on the same things, catching problems earlier, and recovering faster when new failure modes appear.
Make failure visible
If you take one thing from all of this, let it be this: you do not "monitor an LLM." You monitor an end-to-end system that happens to include a probabilistic model in the middle, and most of its failures will look healthy to every traditional dashboard you already have.
So build for replay. Trace the full pipeline with correlation IDs, tag everything with versions, and log enough to answer the only question that matters during an incident: where did the system lose the plot - retrieval, tool call, prompt, model, or guardrail?
Then close the loop. Every user complaint, anomaly, or weird trace should graduate into a labeled failure case, a regression test, and a monitor. Do that consistently and reliability stops being a vague hope and starts becoming a compounding advantage.